
Photo by Carlos Muza on Unsplash
A Documentation of data cleaning using Power Query in Microsoft Excel
A step-by-step guide with illustration.
Table of contents
This article is in response to a data-cleaning challenge thrown at thousands of data analysts across several countries by Victor Somadina and Promise Chinonso. This involves cleaning a messy dataset to make it useful for data analysis.
Problem
A messy dataset was presented in CSV (Comma Separated Values) format containing information on every football player in FIFA still in active service. The screenshot shown below is a section of the raw data as seen in Excel.
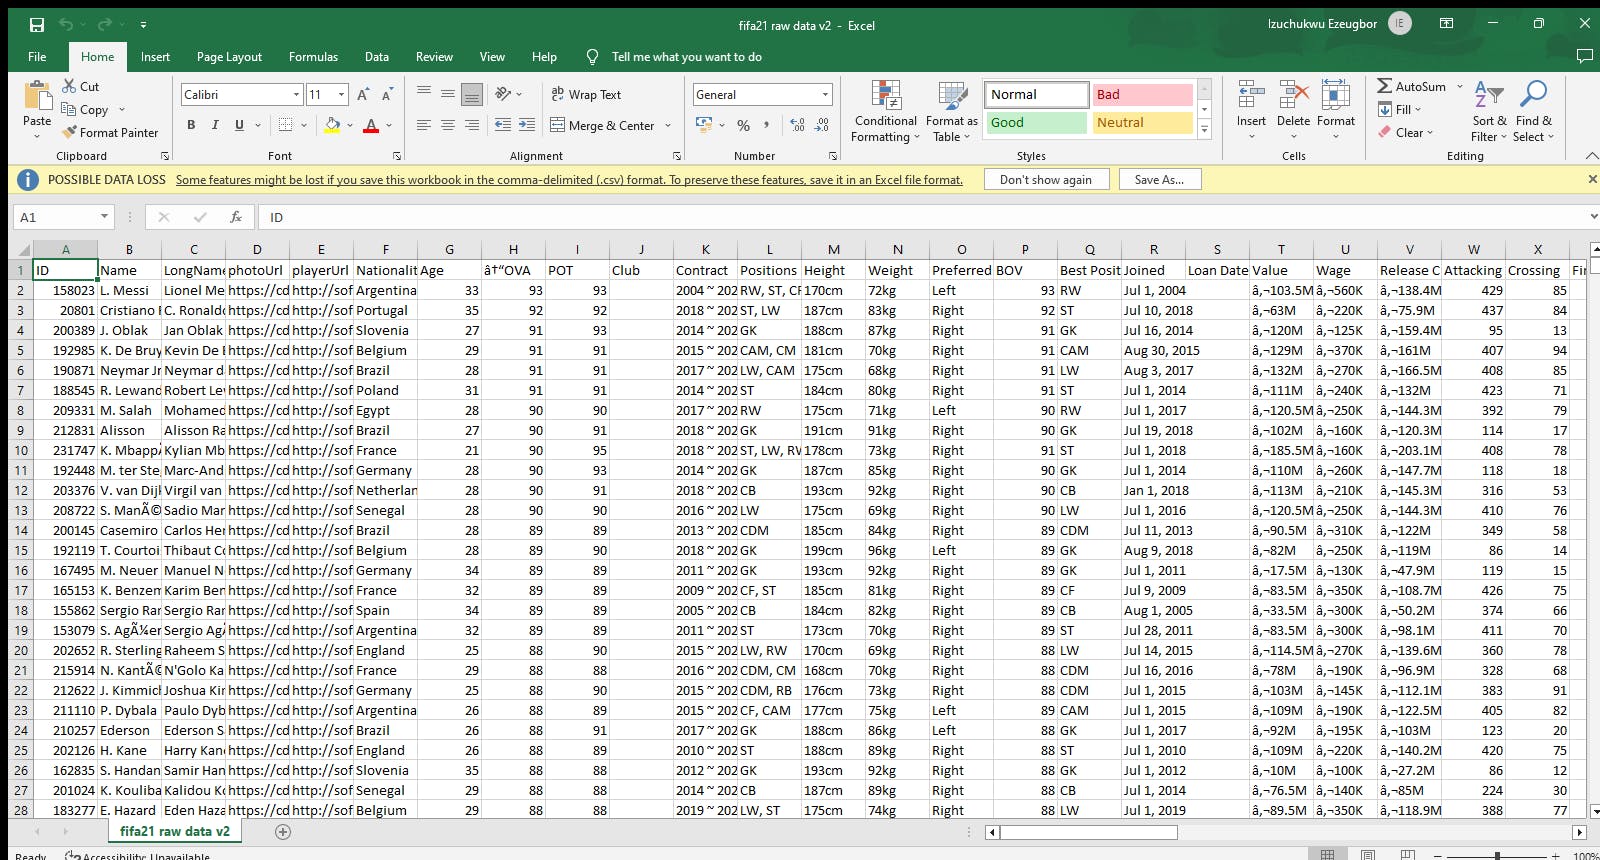
Here, most of the values in the Name, Long Name, Value and Wage columns are littered with non-printable characters and incorrect data types. Looking at this dataset, it is practically impossible to analyse anything because there is nothing to analyse here. To ensure that this data is analysed, it has to be cleaned. Processes involved in data cleaning included the following:
Inspecting the data for non-printable characters, incorrect encodings, wrong data types, wrong spellings, null values, incomplete/blank fields, etc.
Loading the dataset into the Power Query Editor where data is to be transformed and cleaned.
Trimmed the large spaces in the Club column which caused every cell in the Power Query Editor to be unusually large.
Renamed some headers.
Converted some values in height and weight columns from Inches and Pounds to Centimeters and Kilograms respectively.
Changed the data types in the Weight and Height columns to numeric (whole numbers).
For the Value, Wage, Release Clause and Hits Columns; all the data types were changed to numeric (decimal numbers) by removing characters at the beginning of the numbers and letters M and K at the end of the numbers.
In addition to the above, all the numbers that had M at the end were multiplied by 1,000,000 while those having K at the end were multiplied by 1,000. This is to ensure that what was abbreviated as 10.5M is changed to the whole number 10,500,000, etc.
Any other substitutions as deemed necessary.
How the cleaning was done.
The excel version used for this challenge is the 2019 version. The 2016 version has a slightly different method of loading datasets into Power Query. Here on the excel 2019 new sheet, I went to data, then selected "From Text/CSV" as the dataset is in CSV format.

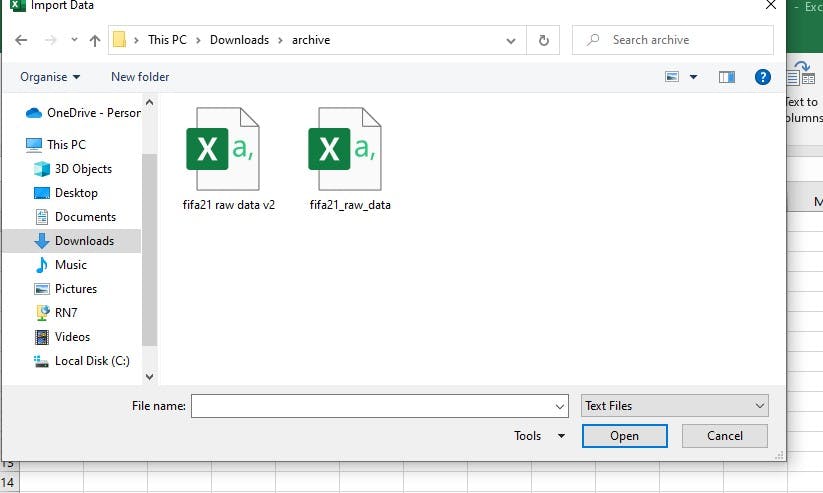
Then I navigated to the dataset in the file explorer and selected "fifa21 raw data v2" as this was the dataset I was to work with.
Then a preview of the dataset is shown below:
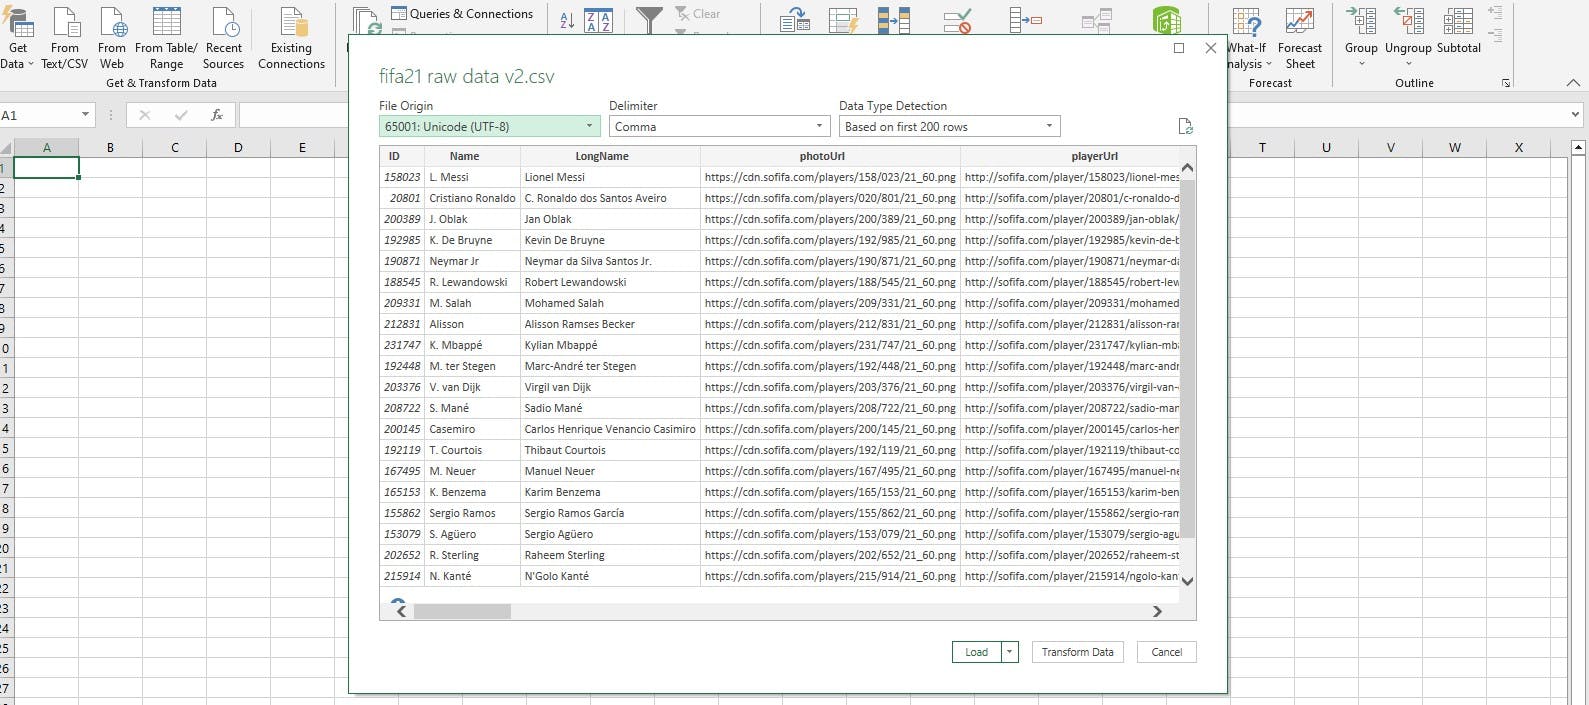
Then I clicked on Transform data at the bottom right of the preview window and the dataset was loaded into the Power Query Editor. Here, data was shown in unusually large cells due to excess spaces in the Club Column.

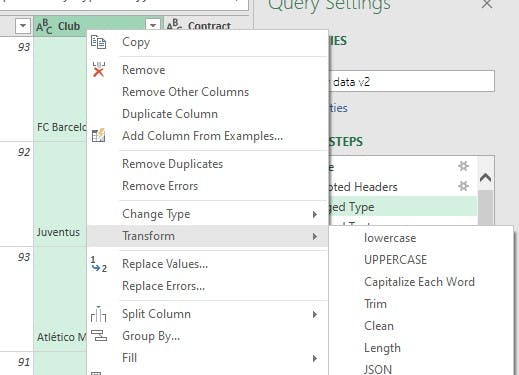
I had to trim the column by right-clicking the Club column header, going to the transform option and choosing trim to remove the excess space therein.
This was the result: a more compact dataset.

Then I replaced the wavy lines between the two values in the contract column by replacing the wavy line with the "-" sign.

Here is the contract column in the before and after:

However, the bulk of data cleaning was in the following scenario:
The weight and height columns contain two different measurements on each of them. While the weight column had some values measured in Kg and others measured in Pounds, the height column contained values measured in cm and others measured in feet and inches.
Value, Wage and Release Clause Columns were in General Data format containing the 'Euro' sign at the beginning and letters M and K at the end of the data.
To resolve the first issue, a measure had to be created to convert the values from pounds to Kilograms as well as values from feet and inches to centimetres.
0.453592kg = 1pound
0.393701inch = 1centimetre
Then a conditional column had to be created to return integers for values in the weight column ending in 'lbs' or 'kg' as well as values in the height column ending in 'cm' or feet and inches.
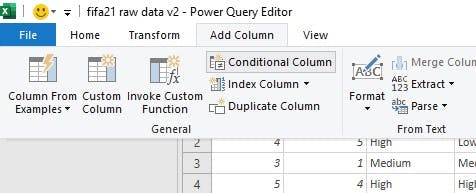
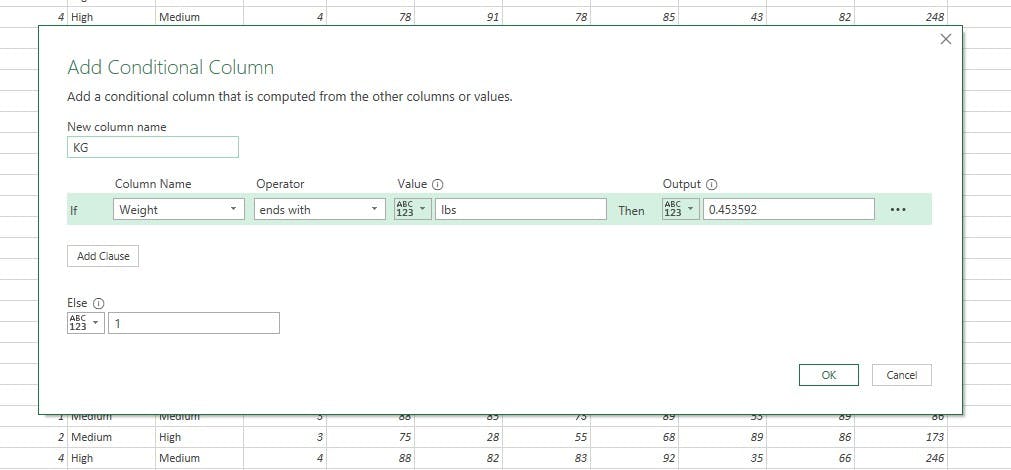
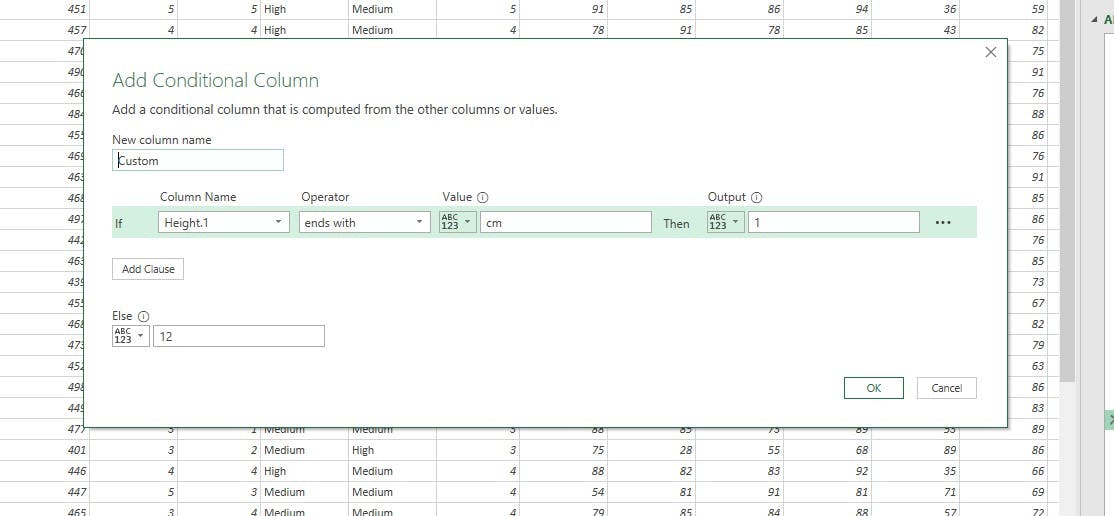
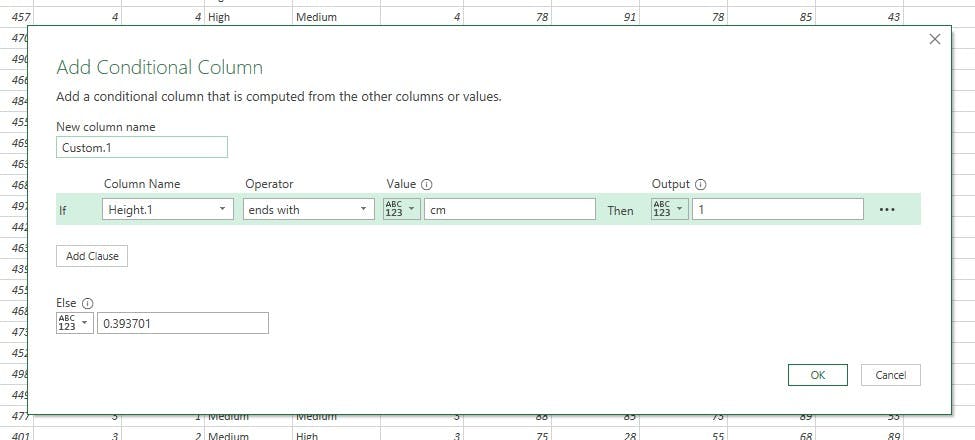
As shown in the above screenshots, the following steps were taken:
The height column was split using the apostrophe as the delimiter. This divided the data measured in feet and inches into two separate columns 'Height1' and 'Height2' where height1 is in feet while height2 is in inches.
A conditional column was created for the Height1 column where values ending in 'cm' were allocated 1 while values that never ended in 'cm' were allocated 12. The purpose is to multiply all the values in the height1 column by either 1 or 12 so that values in cm remain intact while values in feet are converted into inches.
Having removed the 'cm' sign from the hight1 column and changing the data type to numeric values as well as replacing the null values to 'zero' in the height2 column, I added the height1 and height2 columns together to create another column showing the total heights in inches only and centimetres.
Thereafter, the resulting column was divided by another conditional column containing 1 for values in 'cm' and 0.393701 for values in inches thereby converting all values in inches to centimetres while leaving the initial values in centimetres intact; creating a new height column containing values all in centimetres.
All the conditional columns and the heights 1 and 2 columns were removed and the new height column was renamed to height and reordered to replace the original height column. The same was applied to the weight column with the exception that there was no need to split the original weight column and that the weight column was multiplied by the conditional column to give all values in Kilograms.
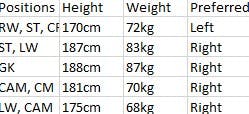
Here is how the height and weight column looked like before the process:
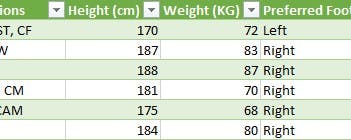
Here is how they look after the process:
In the case of the Price, Wage and Release Clause; conditional columns were created to satisfy the following:
If the Price ends with M, 1000000
If the Price ends with K, 1000
Else, 1
Having created these columns, the data on the Price, Wage, Release Clause and Hits Columns were cleaned by removing those letters and the 'Euro' sign and converting their data types to decimal numbers. Then, these columns were multiplied by their corresponding custom columns to give their actual values in thousands and millions.
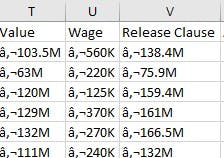
Before the process.
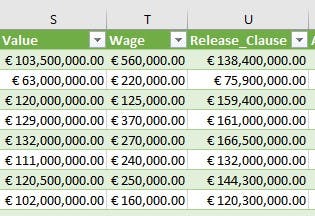
After the columns were cleaned as described.
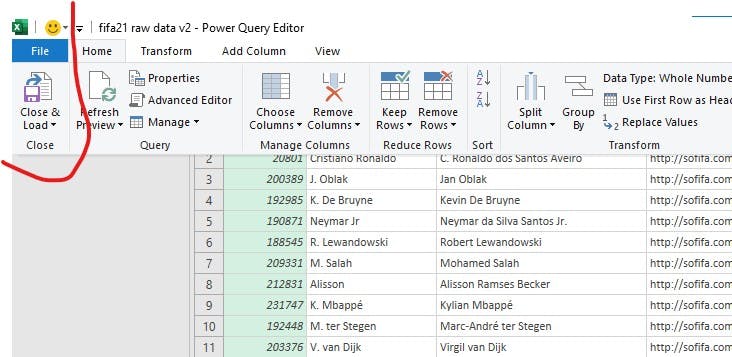
Further minor transformations were carried out which included reordering columns and renaming some headers. Thereafter, the data was loaded into Microsoft Excel using the 'close & load' button on the top left section of the Power Query UI.
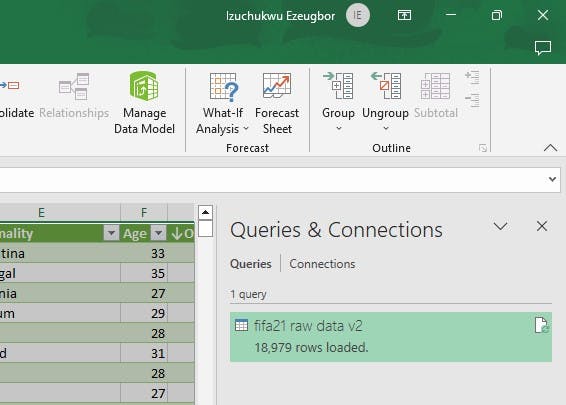
A total of 77 columns and 18,979 rows were loaded into Microsoft Excel with virtually zero error reports.
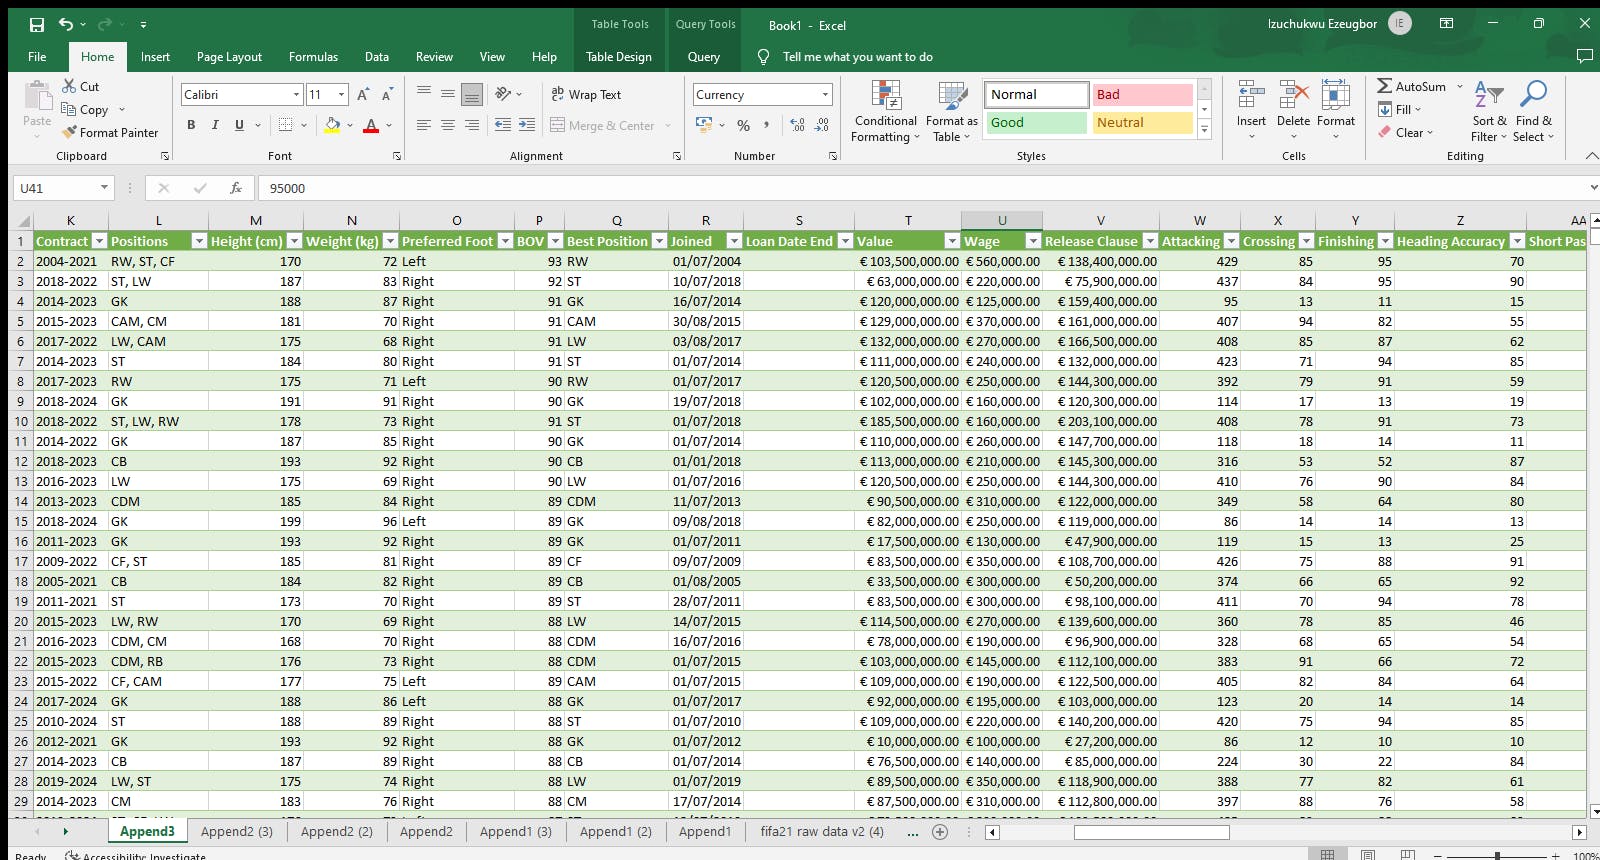
This is the final dataset on Microsoft Excel after all the cleaning and transformations.
Conclusion
I had to start afresh three times after discovering some errors and inconsistencies in the Power Query. This explains the complexities involved in data cleaning where new methods were employed in making data cleaning more efficient and time-saving. I have extracted the Query script from the advanced query editor and pushed the script to GitHub. Do check the GitHub link in my bio for more information.
I hope you have fully enjoyed my documentation. Please don't forget to leave a comment below. I love to read your feedback.
Thank you for your time.
